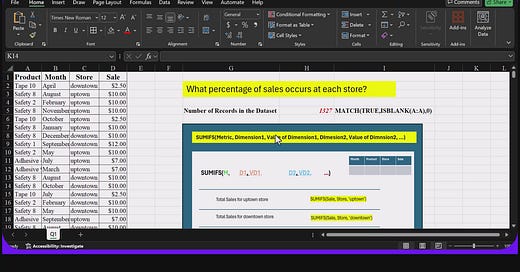
Data summarization is a cornerstone of effective business analysis. In this week’s episode of Pivot Points: Your Guide to Analytical Excellence with Excel, I’m bringing you a step-by-step tutorial on two powerful tools:
SUMIFS() Function: Learn how to sum data based on multiple criteria—perfect for analyzing sales, performance metrics, and more.
Named Ranges: Discover how to make your Excel formulas more intuitive and easier to manage.
📊 What’s in it for you?
This 12-minute video equips you with practical techniques to build dynamic and efficient Excel models. Whether you're summarizing sales by region or analyzing trends by product category, these skills will enhance your data game.
Get ready to transform your raw data into actionable insights—all within Excel!


Share this post